UPDATE Nov 21, 2023: Berkshire Hathaway filed its latest 13F for Q3 2023 with several key updates. While no consumer staples were acquired, positions were added or strengthened in several communication services companies. In Q3, Berkshire increased its stake in Liberty Live Group (NASDAQ: LLYVA, LLYVK), and added small (<$50MM) stakes in Sirius XM Holdings Inc (NASDAQ: SIRI) and Atlanta Braves Holdings Inc (NASDAQ: BATRK). Additionally, positions in Activision Blizzard Inc (NASDAQ: ATVI before Microsoft acquisition) and General Motors Co (NYSE: GM) were liquidated, and holdings in Chevron Corp (NYSE: CVX) and HP Inc (NYSE: HPQ) were reduced.
Is there an opportunity for Berkshire to acquire any value stocks at a discount?
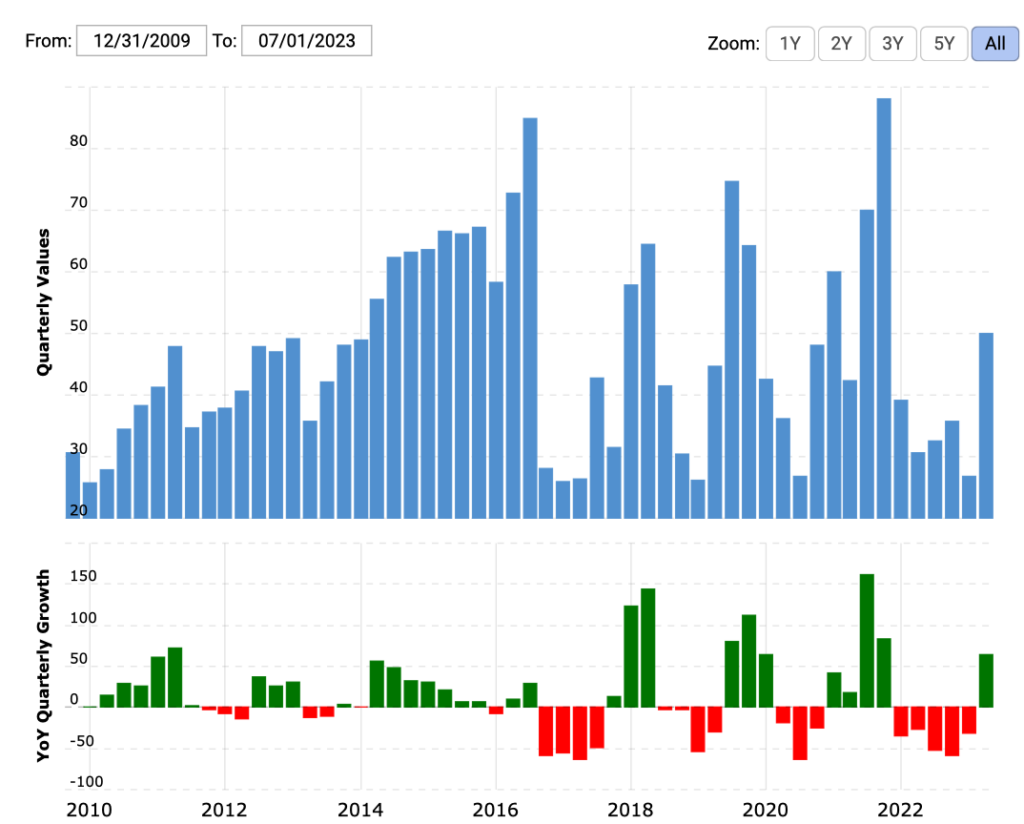
In the realm of investment, the delineation between value and growth is often markedly clear. Berkshire Hathaway Inc. (NYSE: BRK-B), a conglomerate spearheaded by Warren Buffett, has historically been a proponent of value investment, veering towards assets with intrinsic values that are not fully appreciated by the market. As of their last filing in June, the investment titan holds approximately $50 billion in liquid cash, with a total liquidity position of $147.4 billion when considering cash equivalents and short-term treasuries.

Berkshire Cash on Hand Over Time
(May not include all cash equivalents, such as short-term treasuries) Source
The current portfolio (see chart at the bottom of this article) showcases a diverse range of holdings: Apple Inc. (NASDAQ: AAPL) remains sturdy, American Express (NYSE: AXP) is facing a short-term decline, Bank of America (NYSE: BAC) is lingering below its highs amid concerns surrounding smaller banks, Chevron (NYSE: CVX) is holding its ground in comparison to its counterparts, while Hewlett-Packard (NYSE: HPQ) is under the scrutiny for underperformance against its peers. It’s also worth noting the investment conglomerate recently sold more than $400 million worth of HPQ stock, dropping their stake below the 10% threshold requiring active disclosures of stock purchases/sales.
Value Opportunity in Consumer Staples
With a considerable cash reserve and an economic environment where utilities and energy stocks are on a downswing, the question beckons, where should Berkshire channel its formidable financial resources?
One potential avenue is General Mills (NYSE: GIS), a renowned player in the consumer staples sector. General Mills exhibits a robust financial health with appreciable margins and a low debt-to-equity ratio compared to its industry peers, a trait that becomes significantly pertinent in a scenario of rising interest rates. Its standing as a consumer staple mirrors Berkshire’s historical preference towards such entities, with Kraft Heinz (NASDAQ: KHC), Coca-Cola (NYSE: KO), and Kroger (NYSE: KR) being notable examples.
Consumer staples, often characterized by their consistent demand and resilient nature, could act as a defensive play against market volatility, thereby aligning with Berkshire’s value-centric investment ethos. Moreover, the predictable cash flows and dividends associated with consumer staples like General Mills make them a viable candidate for long-term investment.
As the market pendulum continues to swing, and with the upcoming release of Berkshire’s Q3 13F filing this October, the investment community is on alert to discern any strategic shifts in asset allocation. The conjecture around General Mills merely epitomizes the broader quest for value in the consumer staples sector, as the rest of the market experiences turbulence.
The essence of value investing lies in the rigorous analysis and discernment of underappreciated assets with solid underlying fundamentals. It is this principle that has undergirded Berkshire Hathaway’s investment philosophy. In a market landscape where the traditional sectors are facing headwinds, exploring alternative sectors such as consumer staples could potentially unveil undervalued assets that resonate with the foundational investment philosophy of Berkshire Hathaway.
The example of General Mills alongside Berkshire’s historical investment patterns suggests a plausible alignment. Whether this conjecture materializes into a tangible investment, only time (and SEC filings) will tell. Until then, the quest for value remains an enduring endeavor for investors both large and small.
Berkshire Holdings
| Symbol | Holdings as of Jun 30, 2023 | Stake | Price as of Sep 29, 2023 | Value | % of Stock Portfolio | P/E as of Oct 5, 2023 | Beta as of Oct 5, 2023 | |
| Activision Blizzard Inc | ATVI | 14,658,121 | 1.9% | $93.63 | $1,372,439,869 | 0.4% | 34.35 | 0.44 |
| Ally Financial Inc | ALLY | 29,000,000 | 9.6% | $26.68 | $773,720,000 | 0.2% | 6.68 | 1.33 |
| Amazon.com, Inc. | AMZN | 10,551,000 | 0.1% | $127.12 | $1,341,243,120 | 0.4% | 105.00 | 1.24 |
| American Express Company | AXP | 151,610,700 | 20.6% | $149.19 | $22,618,800,333 | 6.6% | 14.92 | 1.19 |
| Aon PLC | AON | 4,335,000 | 2.1% | $324.22 | $1,405,493,700 | 0.4% | 25.27 | 0.89 |
| Apple Inc | AAPL | 915,560,382 | 5.9% | $171.21 | $156,753,093,002 | 46.0% | 29.09 | 1.27 |
| Bank of America Corp | BAC | 1,032,852,006 | 13.0% | $27.38 | $28,279,487,924 | 8.3% | 7.45 | 1.38 |
| BYD Co. Ltd | BYDDF | 98,603,142 | 9.0% | $30.89 | $3,045,851,056 | 0.9% | 26.35 | 0.69 |
| Capital One Financial Corp. | COF | 12,471,030 | 3.3% | $97.05 | $1,210,313,462 | 0.4% | 7.09 | 1.47 |
| Celanese Corporation | CE | 5,358,535 | 4.9% | $125.52 | $672,603,313 | 0.2% | 10.40 | 1.26 |
| Charter Communications Inc | CHTR | 3,828,941 | 2.6% | $439.82 | $1,684,044,831 | 0.5% | 14.77 | 1.12 |
| Chevron Corporation | CVX | 123,120,120 | 6.5% | $168.62 | $20,760,514,634 | 6.1% | 10.34 | 1.17 |
| Citigroup Inc | C | 55,244,797 | 2.9% | $41.13 | $2,272,218,501 | 0.7% | 6.32 | 1.55 |
| Coca-Cola Co | KO | 400,000,000 | 9.2% | $55.98 | $22,392,000,000 | 6.6% | 22.74 | 0.60 |
| DR Horton Inc | DHI | 5,969,714 | 1.8% | $107.47 | $641,565,164 | 0.2% | 7.32 | 1.55 |
| Davita Inc | DVA | 36,095,570 | 39.5% | $94.53 | $3,412,114,232 | 1.0% | 19.09 | 0.94 |
| Diageo plc | DEO | 227,750 | 0.0% | $149.18 | $33,975,745 | 0.0% | 18.35 | 0.41 |
| Floor & Decor Holdings Inc | FND | 4,780,000 | 4.5% | $90.50 | $432,590,000 | 0.1% | 34.04 | 1.96 |
| General Motors Co | GM | 22,000,000 | 1.6% | $32.97 | $725,340,000 | 0.2% | 4.49 | 1.41 |
| Globe Life Inc | GL | 2,515,574 | 2.7% | $108.73 | $273,518,361 | 0.1% | 14.70 | 0.78 |
| HP Inc | HPQ | 100,922,113 | 10.2% | $25.70 | $2,593,698,304 | 0.8% | 11.22 | 1.06 |
| Itochu Corporation | 8001:TYO | 118,331,800 | 7.5% | $36.43 | $4,310,827,474 | 1.3% | 9.7 | |
| Jefferies Financial Group Inc | JEF | 433,558 | 0.2% | $36.63 | $15,881,230 | 0.0% | 25.01 | 1.41 |
| Johnson & Johnson | JNJ | 327,100 | 0.0% | $155.75 | $50,945,825 | 0.0% | 31.55 | 0.57 |
| Kraft Heinz Co | KHC | 325,634,818 | 26.5% | $33.64 | $10,954,355,278 | 3.2% | 12.95 | 0.68 |
| Kroger Co | KR | 50,000,000 | 7.0% | $44.75 | $2,237,500,000 | 0.7% | 19.80 | 0.50 |
| Lennar Corp | LEN | 152,572 | 0.1% | $112.23 | $17,123,156 | 0.0% | 8.03 | 1.48 |
| Liberty Latin America Series A | LILA | 2,630,792 | 6.0% | $8.16 | $21,467,263 | 0.0% | 9.04 | 1.34 |
| Liberty Latin America Series C | LILAK | 1,284,020 | 0.8% | $8.16 | $10,477,603 | 0.0% | 9.01 | 1.34 |
| Liberty Formula One Series C | FWONK | 7,722,451 | 3.7% | $62.30 | $481,108,697 | 0.1% | 37.53 | 1.09 |
| Liberty SiriusXM Series A | LSXMA | 20,207,680 | 20.6% | $25.45 | $514,285,456 | 0.2% | 9.79 | 1.16 |
| Liberty SiriusXM Series C | LSXMK | 43,208,291 | 19.8% | $25.46 | $1,100,083,089 | 0.3% | 9.81 | 1.16 |
| Liberty Live Series A | LLYVA | 5,051,920 | 19.7% | $31.92 | $161,257,286 | 0.0% | – | – |
| Liberty Live Series C | LLYVK | 11,132,594 | 17.5% | $32.10 | $357,356,267 | 0.1% | – | – |
| Louisiana-Pacific Corp | LPX | 7,044,909 | 9.8% | $55.27 | $389,372,120 | 0.1% | 24.87 | 1.70 |
| Markel Group Inc | MKL | 471,661 | 3.6% | $1472.49 | $694,516,106 | 0.2% | 10.50 | 0.75 |
| Marubeni Corp | 8002:TYO | 141,000,200 | 8.3% | $15.72 | $2,216,523,144 | 0.7% | 7.7 | |
| Mastercard Inc | MA | 3,986,648 | 0.4% | $395.91 | $1,578,353,810 | 0.5% | 36.87 | 1.09 |
| Mitsubishi Corp | 8058:TYO | 119,497,600 | 8.3% | $48.04 | $5,740,664,704 | 1.7% | 10.1 | |
| Mitsui & Co | 8031:TYO | 125,022,300 | 8.1% | $36.55 | $4,569,565,065 | 1.3% | 7.0 | |
| MONDELEZ INTERNATIONAL INC Common Stock | MDLZ | 578,000 | 0.0% | $69.40 | $40,113,200 | 0.0% | 22.82 | 0.65 |
| Moody’s Corp | MCO | 24,669,778 | 13.4% | $316.17 | $7,799,843,710 | 2.3% | 39.66 | 1.30 |
| Nu Holdings Ltd | NU | 107,118,784 | 2.3% | $7.25 | $776,611,184 | 0.2% | 703.00 | 1.13 |
| NVR Inc | NVR | 11,112 | 0.3% | $5963.30 | $66,264,187 | 0.0% | 12.72 | 1.03 |
| Occidental Petroleum Corp | OXY | 224,129,192 | 25.3% | $64.88 | $14,541,501,977 | 4.3% | 10.55 | 1.72 |
| Paramount Global Class B | PARA | 93,730,975 | 15.4% | $12.90 | $1,209,129,578 | 0.4% | – | 1.68 |
| Procter & Gamble Co | PG | 315,400 | 0.0% | $145.86 | $46,004,244 | 0.0% | 24.70 | 0.41 |
| Snowflake Inc | SNOW | 6,125,376 | 1.9% | $152.77 | $935,773,692 | 0.3% | – | 0.78 |
| SPDR S&P 500 ETF Trust | SPY | 39,400 | 0.0% | $427.48 | $16,842,712 | 0.0% | 21.39 | 1.00 |
| StoneCo Ltd | STNE | 10,695,448 | 3.4% | $10.67 | $114,120,430 | 0.0% | 22.40 | 2.23 |
| Sumitomo Corp | 8053:TYO | 101,210,400 | 8.2% | $20.11 | $2,035,341,144 | 0.6% | 6.5 | |
| T-Mobile Us Inc | TMUS | 5,242,000 | 0.4% | $140.05 | $734,142,100 | 0.2% | 27.78 | 0.54 |
| United Parcel Service, Inc. | UPS | 59,400 | 0.0% | $155.87 | $9,258,678 | 0.0% | 13.33 | 1.09 |
| Vanguard 500 Index Fund ETF | VOO | 43,000 | 0.0% | $392.70 | $16,886,100 | 0.0% | 21.26 | 1.00 |
| Verisign, Inc. | VRSN | 12,815,613 | 12.4% | $202.53 | $2,595,546,101 | 0.8% | 30.00 | 0.94 |
| Visa Inc | V | 8,297,460 | 0.4% | $230.01 | $1,908,498,775 | 0.6% | 29.38 | 0.95 |
| TOTAL Public Stocks | $340,962,166,935 | 100.0% | ||||||
| Berkshire Market Capitalization: | $754,437,134,132 | |||||||
| Berkshire Cash as of 30 Jun 23: $147.4 billion |
Chart Sources: https://www.cnbc.com/berkshire-hathaway-portfolio/ https://www.sec.gov/Archives/edgar/data/1067983/000095012323008074/xslForm13F_X02/25376.xml https://finance.yahoo.com/


